
Renewable electricity use
GRI 305-1, 305-2, 305-3, 305-5
Climate action
Our goal to reduce emissions in our value chain by 2030, touches upon 6 out of 8 Sustainable Packaging criteria.
50% emissions reduction from our value chain by 2030
Goal
In base year 2021, 274,775 MT CO2e was emitted in LC Packaging’s value chain. Meaning that by 2030, no more than 137,387 MT of CO2e may be emitted in our value chain.
Baseline
LC Packaging’s emission reduction goal includes the company’s full operations and value chain, which includes the direct (Scope 1) and indirect emissions (Scope 2 and 3) of all our sales offices and warehouses, and our FIBC production facilities in Bangladesh and South Africa.
Scope
In 2022, 254,897 MT CO2e has been emitted in our value chain. This means a decrease of 7.2% (18,353 MT) compared to base year 2021.
Progress on goal


In 2022, data availability and quality improved significantly due to among others better product-related data and lifecycle assessments that were conducted for our main product groups. Based on that data, base year 2021 has been recalculated and rectified in this report. Overall, in 2022 we achieved a 7.2% decrease of CO2e emissions compared to base year 2021.
A summary of the results:
Our affiliates and FIBC production facility LC Shankar (LCSH) together managed to bring down their scope 1 and 2 emissions by 9.2% in 2022 (116 MT CO2e), compared to 2021.
As FIBC production facility Dutch-Bangla Pack (DBPL) – responsible for over 80% of total scope 1 and 2 emissions – had to use more energy from the grid, instead of its own generators, its CO2e emissions have increased by 309 MT CO2e.
In total we can conclude a 12.3% decrease of scope 1 emissions and a 23.7% increase of scope 2 emissions.
As scope 1 emissions have been reduced, emissions related to ‘fuel and energy related activities’ have also been reduced (-15%).
Even though in 2022 we distributed more packaging products compared to 2021, less material has been used, leading to a 6.9% decrease in emissions in the ‘purchased goods and services’ category.
Emissions related to ‘capital goods’ have increased with 17.7% due to a larger investment in capital goods in 2022 compared to 2021.
Less sea freight has led to an emission reduction (14.7%) related to 'transportation and distribution'.
Even though we produced less ‘waste’ in 2022, the emissions related to this category have increased by 15.6%, as more waste was incinerated compared to 2021.
As in 2022 COVID restrictions eased, we have experienced an exponential growth in emissions related to ‘business travel’ (+76.8%) and employee commuting (+8.2%). Overall, this still has a small impact (0.2% of total emissions).
Emissions related to upstream 'leased assets' have decreased due to the gradual yet steady transition towards electric lease cars. Downstream leased assets have decreased due to an emission reduction in the dormitories at our main production facility in Bangladesh and fewer cardboard erecting machines leased to customers.
For the 'end-of-life of sold products', an emission reduction of 9.7% has been achieved. This is mainly due to a decrease in the materials used in the distributed packaging compared to 2021, including 3 mln. kilos less plastics.
Explanation

Actions
2022 was the year of collecting data and understanding the high emitting areas in our value chain, resulting in our 2021 GHG Inventory. An important outcome of this research is that by making our packaging deliver the circular economy, we significantly reduce the greenhouse gas emissions in our value chain. Hence, both emission reduction indicators and circular economy indicators are leading in strategic sustainable product development decisions.

01
01
Policies, codes, and commitments
02
Awareness and
implementation
03
Research and
development
04
Data and
reporting
Additionally, all actions mentioned in the chapter ‘Circular Economy’ lead directly to significant emissions reductions in our value chain.
LC Packaging became a signatory of the Science Based Targets initiative (SBTi), and made a public commitment to set science-based targets (SBTs). In January 2023, the targets were submitted for validation.
Policies, codes, and commitments
Our Energy Consumption and Greenhouse Gas Emissions Policy and Sustainable Consumption Policy was updated in line with our climate ambition.
A new Code of Conduct for Key Production Partners has been drawn up and presented to the first group of production partners. This code includes a requested commitment to reduce scope 1 and 2 emissions by 50% by 2030.
Next steps
As looking forward is even more important than looking back, below is an overview of actions we are planning to take next.

Use the available data and research results to update our action plan towards achieving the 50% emission reduction goal, define missing subgoals and take necessary actions.

Finalise the remaining CO2e Product Lifecycle Assessments and define product category targets and sales KPIs in order to boost low-emission product innovation and the sales of these products.

Introduce a CO2e calculation tool to help our production partners to gain insights in and easily report on emissions and reductions on an annual basis.

Introduce a Logistics Supplier Code of Conduct and Sustainable Transportation Policy to be able to discuss and agree on emission reduction ambitions related to transportation.

Further improve data quality and availability leading to more reliable data for GHG reporting and decision making.


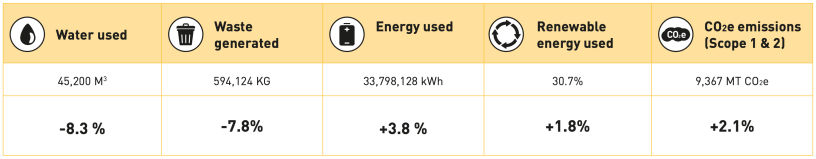
Additional environmental KPIs
In addition to annually reporting on the CO2e emissions in our value chain, LC Packaging also reports on our water consumption, (renewable) energy use and waste production in our own operations. The following graphic shows the results for 2022, compared to 2021:

For more detailed information on the materials used in our packaging, and the circularity of our packaging portfolio, please refer to our 2022 Environmental Report.
2022 Environmental Report

2022 Environmental Report
Committed


© 2023 LC Packaging
www.lcpackaging.com
Renewable electricity use
GRI 305-1, 305-2, 305-3, 305-5
Additionally, all actions mentioned in the chapter ‘Circular Economy’ lead directly to significant emissions reductions in our value chain.
See overview

Climate
action
Our goal to reduce emissions in our value chain by 2030, touches upon 6 out of 8 Sustainable Packaging criteria.
In base year 2021, 274,775 MT CO2e was emitted in LC Packaging’s value chain. Meaning that by 2030, no more than 137,387 MT of CO2e may be emitted in our value chain.
Baseline
50% emissions reduction from our value chain by 2030
Goal
LC Packaging’s emission reduction goal includes the company’s full operations and value chain, which includes the direct (Scope 1) and indirect emissions (Scope 2 and 3) of all our sales offices and warehouses, and our FIBC production facilities in Bangladesh and South Africa.
Scope
In 2022, 254,897 MT CO2e has been emitted in our value chain. This means a decrease of 7.2% (18,353 MT) compared to base year 2021.
Progress on goal

In 2022, data availability and quality improved significantly due to among others better product-related data and lifecycle assessments that were conducted for our main product groups. Based on that data, base year 2021 has been recalculated and rectified in this report. Overall, in 2022 we achieved a 7.2% decrease of CO2e emissions compared to base year 2021.
A summary of the results:
Our affiliates and FIBC production facility LC Shankar (LCSH) together managed to bring down their scope 1 and 2 emissions by 9.2% in 2022 (116 MT CO2e), compared to 2021.
As FIBC production facility Dutch-Bangla Pack (DBPL) – responsible for over 80% of total scope 1 and 2 emissions – had to use more energy from the grid, instead of its own generators, its CO2e emissions have increased by 309 MT CO2e.
In total we can conclude a 12.3% decrease of scope 1 emissions and a 23.7% increase of scope 2 emissions.
As scope 1 emissions have been reduced, emissions related to ‘fuel and energy related activities’ have also been reduced (-15%).
Even though in 2022 we distributed more packaging products compared to 2021, less material has been used, leading to a 6.9% decrease in emissions in the ‘purchased goods and services’ category.
Emissions related to ‘capital goods’ have increased with 17.7% due to a larger investment in capital goods in 2022 compared to 2021.
Less sea freight has led to an emission reduction (14.7%) related to 'transportation and distribution'.
Even though we produced less ‘waste’ in 2022, the emissions related to this category have increased by 15.6%, as more waste was incinerated compared to 2021.
As in 2022 COVID restrictions eased, we have experienced an exponential growth in emissions related to ‘business travel’ (+76.8%) and employee commuting (+8.2%). Overall, this still has a small impact (0.2% of total emissions).
Emissions related to upstream 'leased assets' have decreased due to the gradual yet steady transition towards electric lease cars. Downstream leased assets have decreased due to an emission reduction in the dormitories at our main production facility in Bangladesh and fewer cardboard erecting machines leased to customers.
For the 'end-of-life of sold products', an emission reduction of 9.7% has been achieved. This is mainly due to a decrease in the materials used in the distributed packaging compared to 2021, including 3 mln. kilos less plastics.
Explanation
Actions
2022 was the year of collecting data and understanding the high emitting areas in our value chain, resulting in our 2021 GHG Inventory. An important outcome of this research is that by making our packaging deliver the circular economy, we significantly reduce the greenhouse gas emissions in our value chain. Hence, both emission reduction indicators and circular economy indicators are leading in strategic sustainable product development decisions.

01
LC Packaging became a signatory of the Science Based Targets initiative (SBTi), and made a public commitment to set science-based targets (SBTs). In January 2023, the targets were submitted for validation.
Policies, codes,
and commitments
Our Energy Consumption and Greenhouse Gas Emissions Policy and Sustainable Consumption Policy was updated in line with our climate ambition.
A new Code of Conduct for Key Production Partners has been drawn up and presented to the first group of production partners. This code includes a requested commitment to reduce scope 1 and 2 emissions by 50% by 2030.
02
Research
and development
Awareness
and implementation
A dedicated mandatory online training course has been launched for our employees, explaining LC Packaging’s 50% emission reduction commitment. The course was launched in May 2022 and has a completion rate of 79.9%.
Through dedicated workshops on LC Packaging’s 2030 Ambition, in which 94% of all employees participated, for each business process (e.g., sales, logistics, HR, quality, production etc), ways to contribute towards achieving our goals have been identified and translated into short- and long-term targets and KPIs.
03
In addition to creating the first GHG Inventory, CO2e Product Lifecycle assessments are conducted for LC Packaging’s main product categories to better understand the environmental impact of our packaging, identify the high emitting areas in the lifecycle of our packaging, and identify opportunities to reduce emissions.
Included in the CO2e Product Lifecycle assessment are design scenarios, in order to make strategic sustainable product development decisions leading to an emission reduction in the lifecycle of our packaging.
04
Data
and reporting
To improve the quality and availability of data needed to calculate the CO2e emitted in our value chain on an annual basis, a Data and Reporting Analyst was appointed, which has already resulted in improved GHG calculations over reporting year 2022, compared to 2021. Especially the quality of data related to Scope 3 categories ‘purchased goods and services’, ‘transportation and distribution’, and ‘end-of-life of sold products’ has improved.
Next steps
As looking forward is even more important than looking back, below is an overview of actions we are planning to take next.

Use the available data and research results to update our action plan towards achieving the 50% emission reduction goal, define missing subgoals and take necessary actions.
Finalise the remaining CO2e Product Lifecycle Assessments and define product category targets and sales KPIs in order to boost low-emission product innovation and the sales of these products.

Introduce a CO2e calculation tool to help our production partners to gain insights in and easily report on emissions and reductions on an annual basis.

Introduce a Logistics Supplier Code of Conduct and Sustainable Transportation Policy to be able to discuss and agree on emission reduction ambitions related to transportation.

Further improve data quality and availability leading to more reliable data for GHG reporting and decision making.

Additional environmental KPIs
In addition to annually reporting on the CO2e emissions in our value chain, LC Packaging also reports on our water consumption, (renewable) energy use and waste production in our own operations. The following graphic shows the results for 2022, compared to 2021:
For more detailed information on the materials used in our packaging, and the circularity of our packaging portfolio, please refer to our 2022 Environmental Report.
2022 Environmental Report
2022 Environmental Report

© 2023 LC Packaging
www.lcpackaging.com